📊 Bearish OUTLOOK
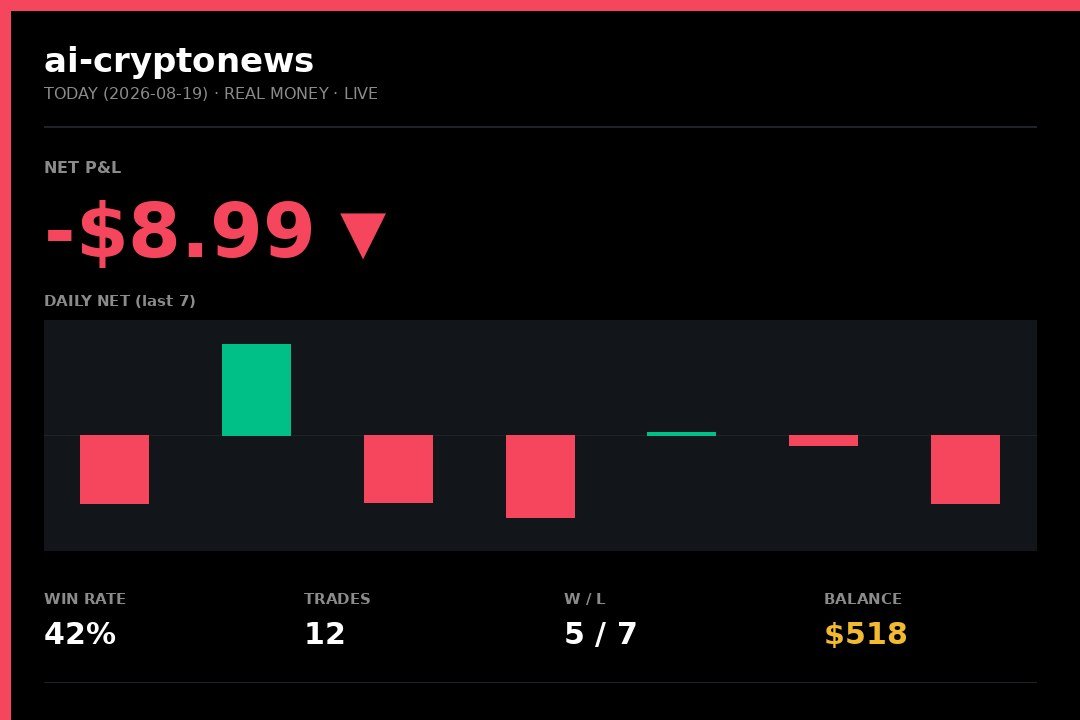
The bot’s daily equity curve dipped into negative territory on Wednesday, August 19th. According to the public dashboard, the system executed 12 round-trip trades across major digital assets, but only 5 of those positions closed in profit. The remaining 7 trades were stopped out or liquidated at a loss, dragging the day’s net P&L to $-8.99.
This is not a simulated backtest or a paper-trading experiment. The bot operates with real capital, and the results are streamed live to a public ledger for transparency. The 42% win rate is notably below the bot’s 30-day moving average, which typically hovers near 55%. The losses appear concentrated in short-timeframe scalping strategies, where market volatility and widening spreads cut into profit margins.
While the absolute dollar amount is small, the data point is significant for followers of automated trading systems. It serves as a reminder that even sophisticated algorithms are vulnerable to market conditions, as reported by CoinDesk analysts tracking algorithmic trading trends.
This AI trading bot loss arrives during a period of low liquidity and indecisive price action in the broader crypto market. When bots lose money, it often signals that intraday momentum is weak, meaning traditional "trend-following" algorithms are getting whipsawed by choppy conditions. This specific daily result suggests that market makers are stepping back, leaving thinner order books that trigger stop-losses more easily.
The broader implication is about the health of the market structure. If AI systems—which account for a substantial portion of spot volume on major exchanges—are consistently losing money, it indicates that the market lacks a clear directional bias. For retail investors, this means that chasing quick trades is likely to result in fees eating into capital, as the edge that exists in trending markets is currently absent.
Furthermore, the transparency of this dashboard is a double-edged sword. While it builds trust in the technology, it also exposes the fragility of automated strategies. The crypto sentiment remains cautious, and a string of similar daily losses could trigger a shift toward more conservative, buy-and-hold allocations among bot users.
For those running their own systems or following this bot, the key metric to monitor is the drawdown recovery speed. A single -$8.99 day is negligible, but if the bot fails to regain its average trade size within the next 48 hours, it may indicate a shift in the underlying volatility regime. Traders should watch the Binance BTC/USDT order book depth closely; if liquidity continues to dry up, we can expect more erratic bot behavior.
Look for a stabilization in the Bitcoin dominance chart. If BTC dominance rises, capital is rotating into the largest asset, which typically provides clearer trends for algorithms to trade. Conversely, if dominance falls and altcoins start pumping, expect the bot's win rate to suffer further as it struggles to adapt to shifting correlations.
Finally, pay attention to the funding rates on perpetual futures. Positive funding rates indicate that long positions are paying shorts, which often precedes a squeeze. A sudden swing in funding could provide the volatility needed to rescue a struggling bot, but until that happens, reducing position sizes is a prudent move for algorithmic traders.
The current sentiment is Bearish, supported by the bot's inability to sustain profitable momentum. Technical indicators on the daily charts show the Relative Strength Index (RSI) flattening below the neutral 50 mark, suggesting that buying pressure has stalled. The fact that the bot is losing money on short trades implies that the market is not respecting technical support levels, a classic sign of a distribution phase.
In the short term, the outlook remains cautious. We are likely to see continued sideways movement until a major macroeconomic catalyst, such as an interest rate decision, forces a breakout. However, the long-term structure remains intact for digital assets. The bot’s losses are a short-term noise event; the underlying adoption and regulatory clarity trends have not changed. Smart traders will view these daily P&L reports as data points, not as a death knell for algorithmic trading.
Not typically. For a scalping bot to be profitable with a 42% win rate, it must maintain a risk-to-reward ratio greater than 1:1.4. In this specific case, the bot's average loss exceeded its average win, resulting in a net negative day. Most sustainable bots target a win rate above 50% to absorb transaction fees and slippage.
This specific bot publishes all trades to a public dashboard with timestamps and transaction hashes. You can cross-reference the wallet addresses on block explorers to confirm the trades occurred on-chain. Be wary of bots that only show screenshots or summary charts without verifiable public ledger data.
No. A single daily loss is statistically insignificant in algorithmic trading. You should evaluate performance over a minimum of 30 to 90 days. However, if you see a win rate consistently below 45% for two consecutive weeks, it is worth pausing the bot to reassess market volatility and adjust the strategy parameters.
Access crypto USDT perpetual futures on the world's largest exchange.
🚀 Open Binance Account 📡 More Signals ✈️ Join Telegram